Master's Thesis · Randall Brown · 2021
Near-Real Time Prediction of
Rotorcraft Traffic Pattern
Executive Summary
Helicopters are amazing machines, capable of helping rescue hikers, getting VIPs to important events, fighting fires, searching for suspect, and helping save lives. Skilled trained pilots and teams of safety experts help enable the beneficial capabilities of helicopters. However, these operations are fraught with specific hazards that can adversely affect the safety of the flight. The National Transportation Safety Board (NTSB) states the crash rate for general aircraft is 7.28 crashes per 100,00 hours of flight time (TorkLaw, 2020). The crash rate for helicopters is 9.84 per 100,000 hours of flight; 35% higher than compared to airplanes. In response to the high fatal accident rate, the aviation community started a program called Aviation Safety Information Analysis and Sharing (ASIAS) to bring together disparate data sources and enable analysis of safety data to identify and mitigate operational risk.
The partnership with UMGC and the Federal Aviation Administration (FAA) aims to help reduce risk to the rotorcraft community by focusing on identifying and detecting advanced flight maneuvers using data mining techniques and data analytics processes. The following paper investigates the feasibility of near-real time traffic pattern detection, identification, and characterization. Using advanced data science techniques to build upon the 2019 paper, Phases of Flight Identification for Rotorcraft Operations by Hsiang-Jui, the model will focus a standard traffic pattern with multi-class predictions.
Project Scope
Problem Description
The helicopter is an agile and beneficial rotorcraft but, unfortunately, has significant risks associated with the operation of the vehicle. Operating at 35% higher risk than other rotorcraft, such as the airplane, has created a need for the Aviation Safety Information Analysis and Sharing (ASIAS), a program dedicated to bringing together disparate data sources to enable analysis of safety data. To address the threat to the vertical flight community such as loss of control, deep analysis is required to analyze complex flight monitoring data. One of the key elements that define these operations is the traffic pattern done when approaching, leaving or in the proximity of a landing strip or landing pad. The standard pattern is one that is paramount to increasing the safety of the surrounding airfield while ensuring a quick and efficient operation of the landing strip.
To date, this has been done ablatively based on pilot performance during check flights or pilot's memory. Growing technology has encouraged the industry to move towards a more data-driven approach to understanding and identifying each phase and traffic patterns to establish a baseline level of risk within an operation and the broader community. To reduce the risk to the rotorcraft community, the focus of this project is to detect, identify and characterize a standard traffic pattern and the phases associated with it by using data mining techniques and data analytics processes This will allow for rotorcraft pilots and control towers to further understand and track rotorcraft in the area, while maintaining awareness of the air space. The impact of this study aims to reduce risk to the rotorcraft pilot community while enhancing current understanding of rotorcraft operations.
There has been substantial work investigating the safety of rotorcraft. The basis of this project stems from Hsiang-Jui Chin's Phases of Flight Identification for Rotorcraft Operations. In which the researcher was able to identify the ability to classify a flight into several phases. The goal of this project is to detect each advanced maneuver and provide some confidence interval for the advanced maneuver detection along with the start/end times of the advanced maneuver. Ultimately, the capability sought is the algorithmic logic for advanced maneuver detection identification. Once developed, the maneuver logic can be implemented continuously as a service in the Rotorcraft ASIAS (RAISE) platform where it can be a component to several loss of control metrics and dashboards already in development.
The Federal Aviation Administration wants to identify standard traffic patterns and its phase with data collected to enable safety and focus on providing more data to the Aviation Expert. Safety is a key pillar to the FAA and the landing, take-off and other part of the traffic pattern ensure the safety of those involved and those around them. To be able to classify the data with the appropriate phase and provide data to increase safety would help save lives. The data analytics problem that I am analyzing is the ability to classify the phases of a rotorcraft traffic pattern and be able to describe the data behind each phase.
Business Understanding
The aviation industry, which includes commercial and the FAA, has a large stake in the safety of rotorcraft operations. In the first discussion with the FAA, safety was clearly of paramount interest for the problem set this project aims to mitigate. To date, several academia teams have worked towards improving data insights on rotorcraft data and identification of key maneuvers and risks. The key Stakeholder is the FAA who is aiming to reduce the risk to helicopter pilots but also increase safety. The difficulty with this data is the myriad of sensors on rotorcraft that provides datasets with varied outputs and non-standardized reporting.
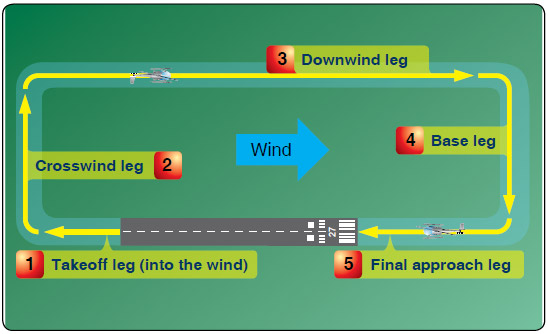
The project has a narrow focus on identifying the phase of the rotorcraft while in a standard traffic pattern. Success of this project would be the identification of the phase There are six phases: takeoff, crosswind, base, downwind, final and touchdown. For a visual representation of the standard traffic pattern, see figure 1 (Traffic Patterns, 2021). The provided insights will be utilized to drive more data driven decisions and enable safety the aviation industry.
Organization
The Federal Aviation Administration sponsored this project with the University of Maryland Global Campus (UMGC) to develop a solution aimed at increasing security of rotorcraft flight and decreasing risk. The program called Commercial Aviation Safety Team (CAST) was created for commercial aviation to reduce fatal accident rate, but the aviation community expanded to include vertical flight. The Aviation Safety Information Analysis and Sharing (ASIAS) program was created to bring together data and encourage data driven insights. The threat of loss of control affects all aviation communities and has a central focus by the community at large.
This project builds on the work documented in various sources and currently being developed out further by Georgia Institute of Technology, Rowan University, and other partners within the ASIAS program. The inclusion of UMGC highlights the impact academia research has on the problem set at hand. The identification of traffic pattern phase and the further garnered insights prove to greatly enhance current rotorcraft operations. The final project being directly integrated into the RAISE platform where it can help drive data driven decisions and be proliferated across the aviation industry.
Stakeholders
The key stake holder for this project is the Federal Aviation Administration. The FAA NextGen Aviation Research Division, Software and Systems Branch (ANG-E27) Chief Data Office (CDO) is the sponsor requesting UMGC partnership on this project. The following are key personnel the team is communicating with:
- Research Engineer and PM
- Chief Data Officer
- Federal Contractor researching flight dynamics
- Deputy Director for Safety Enhancement
- Researcher on safety and gps data
- Researcher 1
- Researcher 2
The CDO has an interest in developing on the data and generating insights as part of their job duties and role. Several Academia teams' partner with the FAA and will continue the research provided in this project. The continuation of this project requires well documented processes and code. The project focus' on the FAA's mission to provide the safest, most efficient aerospace system in the world. (FAA Mission Statement)
Define Business Area
The business area for this project is within the aviation community, specifically the vertical flight community and sponsored by the FAA NextGen Aviation Research Division, Software and Systems Branch. ANG-E27 has a mission to Develop scientific solutions to current and future air transportation challenges by conducting applied research and development in collaboration with industry, academia, and government. Focusing on software and safety systems, the ANG-E27 and this project aim to develop further research in vertical flight safety. This directly aligns with the National Aviation Research Plan (NARP) FY 2020-2025, which states one of their goals are to improve integrated modeling capabilities and system-wide analysis.
Business Objectives
The FAA has the mission to improve the safety of flight, identify areas of research that can provide more information to pilots, and identify data which can be ingested into other systems to improve overall safety and recognition of risk. The focus of the FAA is most often on the aspect of improving safety by means of advanced data analytics or improving current systems. The goal of this project is to identify phase in a standard traffic pattern in rotorcraft data to improve the safety of operation and decrease overall risk.
The business objective of safety comes from the need, as vertical rotorcraft accidents are often fatal, when they occur. To be able to reduce the risk of fatality and injury with the use of pre-existing data would be impactful. Utilizing the sensors on rotorcraft to identify the phase within the traffic pattern, the FAA can make informed decisions such as mandatory sensors for safety and the identification of pilots that are at higher risk than others. The end state is the ability to integrate a near-real time feedback of phase of flight within current aviation systems to revolutionize and increase safety in the aviation community.
The outcome of this project will be the inspiration of new development in other data analysis problems. Applying the agile cycle to this large problem set will enhance the overall capabilities of the FAA. The constant iteration of data analysis and development into new research will highlight the areas of research with more potential and circle back to the first business objective of increasing security and reducing risk.
The third business object is the FAA's capability to identify key data sets that need to be ingested and analyzed for pilot safety. The PEGASUS system and RAISE system will continue to be key systems in the insurance of pilot safety. As the system ingests more data, the platform will continue to be 'smarter' and build upon fundamental research to create a real-time component to rotorcraft operations and safety.
Business Success Criteria
The success of the project is closely tied to the mission and customer problem set. The following are key objectives identified to help guide the overall project to success:
- The model is in format that can be utilized with existing software in the FAA
- The model can identify the rotorcraft phase in a traffic pattern and describe why that data proves it.
- Insight into a traffic patterns, near-real time analytics and new concepts or understanding of the data is well presented.
These three business success criteria were identified because of how they align to sponsors goals and mission. The project needs to be in a modular code format, so that, the information can be reproduced and populated into existing systems. If the code is not able to be utilized, then the project is not a useful output. A large focus, as discussed, is the identification of the phase in the traffic pattern in the data set and being able to describe, mathematically, what happens to allow that phase to stand out. The natural output of this should be some new insight into the rotorcraft near-real time analytics as explained in algorithms and modeling. These three criteria create a clear picture of what the minimal viable product (MVP) for the output of the project is. It also focuses on the need for the FAA to implement quickly on new research and be able to continue upon the research afterword's.
Background
This project builds upon the work documented in the various references and currently being developed by Georgia Institute of Technology, Rowan University, and other partners within the ASIAS program. Using the list of maneuvers, FAA simulation and flight data, as well as the SME from the rotorcraft safety research team, the project with utilize the latest data mining and data analytics techniques to identify, characterize and analyze rotorcraft flight maneuvers. The goal is to be able to detect each phase and provide some confidence interval for the phase detection along with the characterization of the phase. The capability sought is the algorithmic logic for phase detection/identification that can be developed and deployed continuously as a service in the RAISE platform. This would allow for new ways to visualize safety for the operators, increase safety and reduce risk of rotorcraft operations.
Research
The laid-out project is built upon the research previously developed and in large part to be incorporated into the phases of flight research developed by Hsiang-Jui Chin. This research focused on using models such as piecewise linear regression, sliding window regression classification (SWRC), association rules, logistic regression, naïve bayes classifier, linear and quadratic discriminant analysis, k-nearest neighbor, decision tree and random forest models. That paper proved that for high-altitude phases of flight, the SWRC model performed the best in terms of average accuracy across all samples. For the low-altitude phases, the filtering approach with some constraints was the best performing. The combination of each proved to accurately provide the phases of flight. The next step to use this same type of research to identify when a maneuver is happening in that specific phase of flight and be able to detect, identify and define the characteristics of the advanced maneuver. These maneuvers can happen during a traffic pattern, therefore, identifying and characterizing a traffic pattern helps to understand what typical patterns look like and how that impact future advanced maneuver research.
Gaps in this Problem Resolution
The current system (PEGASUS and RAISE) does not currently support the identification and detection of rotorcraft traffic patterns. When analysts perform after action reports, they must manually plot, analyze, and identify potential maneuvers and patterns. During the debrief of a pilot, they may also forget that they had to perform a certain set of maneuvers to avoid a risk, but that set of maneuvers could have put the pilot at more risk. Also, the flight logs often miss information on phase of flight due to lack of calling the phase out or other issues. This gap in detection and identification of advanced helicopter maneuvers and patterns is what this project aims to mitigate. The impact of this work will help increase the safety of rotorcraft operations, while at the same time reducing the overall risk to the pilot.
Proposed Project
The proposed project will build upon previous research to identify, detect, and characterize helicopter phase in a standard traffic pattern within simulated flight data. The provided data sets are extremely well documented with no data quality issues and will be utilized in a supervised machine learning model to identify the phase. The maneuvers that are seen in this project are the steep approach and the shallow approach (also known as the running/roll-on landing). These two maneuvers are common maneuvers and aims at making the data more generalized so that it can incorporate variability.
Although not the most fatal, landing is the most dangerous and difficult phase of rotorcraft operations (Robinson, et al., 2021). The U.S. Join Helicopter Safety Analysis Team (JHSAT) found that 20.65% of accidents occurred in the landing phase of the flight and a further 6.88% occurred during the approach phase, in a review of helicopter accidents in the years 2000, 2001 and 2006. This further emphasis the need for an algorithm to provide additional insight into the operation of rotorcraft and the importance of predicting phase of the traffic pattern. The resulting analysis will increase the safety of the helicopter operator while reducing the risk.
Key Performance Indicators
The ability to detect, identify and characterize phases of a traffic pattern in flight simulation data would increase the safety of pilots and reduce the risk of overall operation. To be able to measure the success of the project, key performance indicators can be utilized to specifically characterize the success of the project. The following four indicators are defined, measurable and correlate back to the mission of the FAA. The overall success can still be a net gain even if indicators are not met to its full extent. The main goal of the FAA is to find what research and development ideas are worth pursuing and those which are not.
The first KPI is to be able to identify an phases of a standard traffic pattern in the simulation data with minimum of 80% confidence level and the ability to explain the reason behind it. The accuracy of the model will be integral to the future integration of the model into other systems. It also helps the analyst who may be overlooking the data in a review to increase speed of phase identification. Failure of identification of the phase is not necessarily a negative, as the absence of being able to detect them is within intelligence to the overall operational picture. The project is hypothesized that the discovery of phases will be possible by some means but the level of advanced methods might be minimal.
The second KPI is the ability to predict the multi-class target variable with phases having similar accuracy. If the model is focused on multi-class classification, then the confusion matrix provide as the output should have similar accuracy for each class. If one class if significantly different in accuracy the model may be choosing to forego a specific group to increase the overall accuracy. A cost value can be added to help mitigate the effects of this.
The third KPI is the ability to describe what ideal parameters are for a phase by providing at least 1 mathematic formula to classify the phase. For this KPI, the model should be able to return a mathematical formula that can be applied to a wider set of data sets and integrated within the PEGASUS and RAISE systems. The importance of model explain ability is paramount to the success of the program and imperative to increase the transparency of data behind flight operations. As more data driven decisions are being made, transparency of models will be critical to improve trust in the performance of new technologies.
The fourth KPI can provide additional insight to a phase of the traffic pattern that will be implemented in systems such as the Digital Co-Pilot to increase safety and reduce risk. To measure this KPI is difficult as the resulting output focus on both the success or non-success of the project and focuses on the success being placed in the value of intelligence generated from the research. If a hypothesis fails, the value from that failed hypothesis is just as important as the successful one. Overall, this KPI focuses on being able to tell the story and provide at least one new concept to the aviation industry.
Project Insights of your Data Analysis
The proposed project will build upon previous research to identify, detect, and characterize helicopter phase of flight in a standard traffic pattern within simulated flight data. The project hypothesizes that some sort of time series segmentation, supervised learning, or unsupervised learning will be able to detect, identify and characterize phase of a standard traffic pattern. The expectation for the project is that several data science algorithms will be tested against the problem set to be able to identify which method works the most optimally. In previous research, several data science models were utilized to identify the phases of the flight. The benefit of analyzing several models on the data allows for the best understanding of how the data will be processed and what features may stand out that may not otherwise.
The mission of safety and focus on providing transparent models means that the process of the development is just as important as the final output. The insights gained along the way will add to continuing research that the FAA is constantly working towards. At the end of the project, a lesson learned and a thorough breakdown of methods that worked and methods that did not work, will all contribute to the community in impactful ways. In the desired deliverables, the software, statistical methods, and a report are all included. Via these mediums the overall research process will be documented and build out.
Phases of a standard traffic pattern may prove difficult to find but the study will also characterize the difficulty of finding the phase. The addition of two landing/approach maneuvers reiterates the importance of generalization of the model and safety and the need to create transparency in accident data. The research provided could be applied to future data sets but also to previous research and analysis to create a larger operational picture. The results should provide the FAA the information needed to identify, detect, and characterize phase of flight in a standard traffic pattern in an automated means. The further development can lead to near-real time maneuver detection and increase safety and reduce risk to the pilot operator.
Project Milestones
The project is part of UMGC's partnership with the FAA and the milestones largely follow the courses timeline and due dates. Due to the complexity of the data, the classification and start of data modeling will happen much sooner than in the class and will probably be done in an iterative agile fashion. Below are the identified milestones expected in the development of the project.
- Develop Project Scope (End of Week 4)
- ETL data with exploratory analytics (End of Week 6)
- Initial Classification or Model Development (End of Week 7)
- Pivot Hypothesis or Model, if needed (End of Week 9)
- Develop Models (End of Week 10)
- Compile Results and Create Data Story (End of Week 11)
- Create Final Results and Produce Presentation (End of Week 12)
Completion History
| Week 1 | Kick-Off Meeting With FAA Read several research papers on previous projects |
| Week 2 | Received Data Meeting with Stakeholder to discuss the data and start generating ideas and goals Created Initial Scope document for review. |
| Week 3 | Started understanding the data developed initial ETL plans Initial data exploratory visualizations |
| Week 4 | Finished Project Scope and compiled into documentation Started basic plotting of data Set up re-occurring meetings with FAA for remainder of project |
| Week 5 | Weekly meeting with FAA Started working on presentation for class |
| Week 6 | Weekly meeting with FAA Started data wrangling Finished Presentation of scope for class Reviewed others presentations |
| Week 7 | Weekly meeting with FAA canceled Received second data set Worked on Assignment 3 Merged Data into single data frame |
| Week 8 | Weekly Meeting with FAA Created several visualizations for the data Created an initial decision tree model Briefed model to FAA for feedback Created and gave presentation Two |
| Week 9 | Weekly Meeting with FAA canceled Created Final visualizations Completed Assignment 4 |
| Week 10 | Tracked a Finished Models Completed Assignment 5 Briefed status to FAA |
| Week 11 | Finished Final Presentation Finished Final Report Wrap up and brief final report to FAA |
Lessons Learned
| Week 1 | This week, the lessons learned are more to deal with understanding the complex nature of aviation data. Overlooking the research, a lot of complex analysis is done to achieve simple results. The biggest challenge will be breaking down the data into a rich enough data set to create insights. |
| Week 2 | This week, the lessons learned are to take the time to read documents and understand the information fully. There is a lot of data and knowledge and to be able to accurately provide insight for the community, a deep understanding of this data will be paramount. |
| Week 3 | This week, the lessons learned are to spend more time learning potential solutions and prepare for them. Now that I understand more of the data, the potential data modeling methods are harder to grasp and most of them are leading edge. Time will need to be spent diving into this area to prepare for potential methods that will be helpful. |
| Week 4 | This week, the lessons learned are to get ahead. The start of the documentation has been slow and time consuming, but the need for well-documented process will be ever more important as the research continues. |
| Week 5 | This week I really dived deep and finally understood a lot of the data behind the FAA's goals. The FAA clarified the scope and by watching a few videos of the standard flight pattern, I was able to understand what the goal was. |
| Week 6 | This week was really a time-consuming process of analyzing the data. Because the data is in time series and because they are of different times, I opted to combine them into one large data set with some labels. I will have to look out for noise in the data. |
| Week 7 | This week I learned a little more on the data, understanding the variables and getting more comfortable with the data and where it will be useful. |
| Week 8 | This week I learned a how-to important customer feedback is. Being able to brief my project to the FAA allowed me to have a better understanding of my own models as well as pivot to ensure models were well made to fit the FAA needs. |
| Week 9 | This week was focused on time management. After just briefing the presentation two and having to revise and update the final product meant that I had to spend a lot of time doing tedious work on top of life duties. |
| Week 10 | This week I learned how to best track multiple models and the differences. The information that can be gleaned from doing many runs of similar models can really help provide additional insight. |
| Week 11 | This week I learned how to take a long and complex topic and condense it into a clear presentation. Being able to boil down the most important parts while still having the information for others to reproduce your work is a challenge but worth it. |
| Week 12 | This is the final week and I learned to be proud of my work. There is so much more I would love to do but, the fact that I was able to complete this work and feel proud on the output, I think overall it is a success. |
Data Set Description
The FAA has over 500 hours of simulated and flight test data from the FAA's S76-D helicopter simulator and its former S76-A helicopter flight test platform. The data is in .csv format that is easily shareable and extremely well documented. The rotorcraft .csv data consists of helicopter flight monitoring data (i.e., flight data recorder data). As such, the data contains parameters comprising typical rotorcraft state information in a standardized format which has been developed independently of differences due to recorder manufacturer or helicopter make/model/series. The parameters in the data include, but not limited to:
- Time
- Position (Latitude, Longitude)
- Groundspeed
- Airspeed
- Altitude
- Attitude (i.e. Pitch, Yaw, Roll {and their corresponding rates})
- Heading
- Landing Gear Status (Up/Down)
- Weight on Wheels (Yes/No)
- Rotor Torque
- Rotor RPM
- Engine RPM
- Engine Oil Temperature and Oil Pressure
- Accelerations (Lateral, Longitudinal, Vertical)
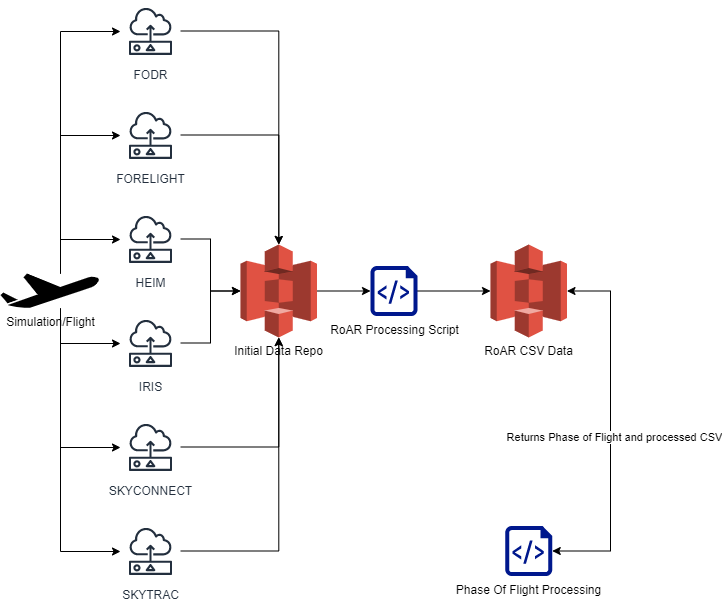
The FAA provided three data sets identified as key: Rotorcraft Analysis Recording (RoAR) standardized data sets, Individual sensor data sets and a post-process phase of flight data set. Each of these datasets are either directly from flight sensors, flight simulation or datasets used in previous research. Each of these data sets focus on GPS location, sensor data, altitude data, system engagements and much more. The data aims to provide insight into the flight and controls of the rotorcraft operations. This data has been utilized for previous research and has proven to be able to provide insights into the operations of rotorcraft and should be sufficient in the identification of advanced maneuvers.
The specific sensor data is broken up into six individual CSV's; FODR, FORELIGHT, HEIM, IRIS, SKYCONNECT AND SKYTRAC. Each of these sensors has raw provided output and a .roar csv file that takes the information and modifies it for ROAR specification. The RoAR specification provides the JSON structure for the movement of flight data. The goal is to help standardize flight data across the community and level set analysis tools. As mentioned previously, sensor data can be spotty, and the data may or may not exist. The RoAR csv of each of these systems is a post-processed version of the data.
Each of the sensor data is combined into a single RoAR CSV and the Simulation data is an example of that. The FAA provided seven different timestamps of simulation data where the format is in RoAR specification. The data was taken on January 20th, 2021, between 0900 and 1500. This data follows the 0.1.17 version of RoAR specification provided by the FAA and a table of the data and the definition is seen below. This data is probably the first data set that can be used in the analysis. The individual sensors have too raw of data, but the RoAR data is what is standard across the community for analysis. It is nice to be able to see where the data came from but the flight data from the simulator will be used to explore the data and proceed with the analysis.
The last dataset provided is the post-process data set for the phases of flight work. The data was ingested via an AWS S3 bucket, process via a python lambda function and pushed back out to an AWS S3 bucket. The data is useful information, and the phases of flight metric may be incredibly useful when developing the model out. The data columns, as seen below, are not RoAR format but are further processing on the data. If able, recreating the phases of flight work might prove useful and be additional to the model.
All data is relatively clean with little to no need for data cleaning or data aggregation. Depending on the feasibility of research paths, ideally being able to use time series segmentation on the data to extract landing phases and then aggregating the data across csv's would be ideal. There may be a need to aggregate but the second so that all timeseries data can start at second one and be compared by the second instead of multiple points per second. Overall, the data is clean, has a lot of features and should be very useful for creating a model for finding advanced maneuvers in rotorcraft data.
The FAA has over 500 hours of simulated and flight test data from the FAA's S76-D helicopter simulator and its former S76-A helicopter flight test platform.
High-Level Data Diagram
The data comes from simulation data and is comprehensive of the data that would come from actual flight information. The data comprises of six individual sensors that are providing JSON data. The data is processed into a RoAR format for further analysis and dissemination. The other data set that was provided was built upon the phase of flight research done previously. The RoAR csv and the phase of flight dataset are going to be the most useful in developing out key features that are used to develop a model to detect advanced rotorcraft maneuvers.
Data Definition/Data Profile
The two datasets that are being used are the Sim Data and the post-processed phase of flight data. The benefit of this data being from a simulation flight is there is no missing values, and the data has an extremely good quality. There are no issues with the quality of the data or any concerns with the data being incorrect. In the real world, the sensors can be calibrated incorrectly and lead to some issues but for this project, that is not the worry. It is noted that this data does have pilot bias. The data will be trained off FAA pilots with extreme training but when applied may have significant different results to the other pilots and real-world factors.
The row data sources are described below with column names and column descriptions. The data has been checked for missing values, and it is confirmed that all data is missing no values. The Sim data consists of 109 columns and varies but total, has over 500,000 records. The phase of flight data consists of 34 columns and 1000 records. The combination of these two data sets will be a good starting point to develop the project on. The dataset will be able to identify advanced maneuvers in rotorcraft data and provide insight to the aviation community.
SimData
| _id | [AIRCRAFT_ID]:[RECORDER_ID]:[START_TIME_IN_MILLISECONDS]: [END_TIME_IN_MILLISECONDS] |
|---|---|
| date | Date of data point, in format DD/MM/YYYY |
| time | Time stamp of data point, in format of HH:MM:SS.MM |
| latitude | Rotorcraft latitude |
| longitude | Rotorcraft longitude |
| gpsAltitude | A geometric altitude measured in reference to the WGS84 elipsoidal model. GPS altitude is a close approximation to true altitude. |
| absoluteAltitude | The altitude above ground level where derived from means other than radarbased altitude equipment, in which case the altitude would be more directly considered the 'radio altitude'. |
| magneticHeading | Heading measured from the magnetic poles. This heading is directly realted to the magnetic poles as with AHRS. However, magnetic heading devices can be inaccurate based on intererance from the rotorcraft, in which case, deviation correction would need to be applied in order to become accurate again. When deviation correction is applied magnetic heading is then considered to be compass heading. Magnetic heading equals true heading +- variation. |
| trueHeading | Heading that is relative to the geographic poles. True Heading equals true course +- wind correction angle. |
| pitch | Rotation on the y-axis; aircraft pitch attitude |
| roll | Rotation on the x-axis; aircraft roll attitude |
| yaw | Rotation on the z-axis |
| groundSpeed | Horizontal speed of the aircraft relative to the ground. Ground speed can be determined from (1) GPS, (2) radar or (3) corrected true airspeed accounting for wind. |
| indicatedAirspeed | The indicated airspeed (IAS) is the uncorrected reading obtained from the airspeed indicator. |
| trueAirspeed | Corrected calibrated airspeed for air temperature and atmospheric pressure variations. |
| climbOrDescentRate | The climb or descent rate (a.k.a., altitude rate or inertial vertical speed), indicates whether the aircraft is climbing, descending, or in level flight; e.g., indicated by vertical speed indicator (VSI) a.k.a variometer |
| barometricAltitudePilot | (Pilot) An atmospheric altitude (a.k.a pressure altitude) read off the altimeter when the pressure is set to the standard pressure (i.e., 1013.25 hPa / 29.92 inHg). When this value is under the transition altitude (i.e., < FL 180), flight systems may typically adjust (outside of this parameter) with local QNH data resulting in a synthetic indicated altitude |
| altimeterSetting | Pilot Altimeter Setting. The value of the atmospheric pressure used to adjust the sub-scale of a pressure altimeter so that it indicates the height of an aircraft above a known reference surface (e.g., ground (< FL 180) or MSL (> FL 180)). Once the altimeter is adjusted to the altimeter setting, the altitude represents true altitude at field elevation. |
| pilotRadioAltitude | Relative to the pilot's position, a radarbased altitude that represents absolute altitude. Absolute altitude is the distance above ground level. |
| copilotRadioAltitude | Relative to the copilot's position, radarbased altitude that represents absolute altitude. Absolute altitude is the distance above ground level. |
| hasWeightOnWheels | Indicates weight on wheels; whether rotorcraft is on the ground or airborne. |
| compassHeading | Heading that includes magnetic heading corrected for deviation. A magnetic direction indicator or gyroscopic direction indicator would reflect the compass heading value. |
| groundTrack | Ground Track Inertial (a.k.a., true course) is true heading with wind corrections. |
| rollRate | The rotorcraft roll rate |
| pitchRate | The rotorcraft pitch rate. |
| yawRate | The rotorcraft yaw rate. |
| turnRate to degPerSec | Not listed |
| driftAngle | Drift Angle of the Helicopter from established course or heading. |
| angleOfAttack | Not listed |
| flightPathAngle | Flight path angle from flight director or fms. |
| verticalFlightPathAngle | Vertical flight path angle from flight director or fms. |
| horizontalFlightPathAngle | Horizontal flight path angle from flight director or fms. |
| rollAcceleration | Acceleration relative to roll. |
| pitchAcceleration | Acceleration relative to pitch. |
| yawAcceleration | Acceleration relative to yaw |
| lateralAcceleration | Acceleration to the side |
| normalAcceleration | A.k.a., centripetal acceleration; acceleration on the z-axis. |
| longitudinalAcceleration | Acceleration in a straight line |
| cyclicPositionPitch | Neutral is zero. Aft is by positive percentage. Forward is by negative percentage. |
| cyclicPositionRoll | Neutral is zero. Right is by positive percentage. Left is by negative percentage. |
| collectivePosition | Full-down/Neutral is zero. Up is by positive percentage |
| antiTorquePedalPosition | Neutral is zero. Right is by positive percentage. Left is by negative percentage. |
| leftBrakePosition | To be defined. |
| rightBrakePosition | To be defined. |
| throttlePosition | Rotorcraft throttle position |
| hasParkingBrakeEngaged | The parkingbrake is engaged or disengaged |
| hasLandingGearDown | Indicates the landing gear is down |
| hasRotorBrakeEngaged | If engaged, the rotor brake is on and the rotor RPM equals zero; i.e., the rotor cannot turn. |
| totalFuelWeight | To be determined |
| grossWeight | The gross (instantaneous) weight of the rotorcraft in pounds. |
| e1FuelFlowRate | The fuel flow rate. |
| e2FuelFlowRate | The fuel flow rate. |
| e1FuelPressureGauge | The fuel pressure. |
| e2FuelPressureGauge | The fuel pressure. |
| e1OilPressure | Engine oil pressure |
| e2OilPressure | Engine oil pressure |
| e1OilTemperature | Engine Oil Temperature |
| e1Temperature | Engine temperature |
| e2Temperature | Engine temperature |
| e1Torque | Percent of torque. |
| e2Torque | Percent of torque. |
| e1N1ng | The percentage of rotation speed of the 1st (compression) stage |
| e2N1ng | The percentage of rotation speed of the 1st (compression) stage |
| e1N2nf | The percentage of rotation speed of the power turbine stage |
| e2N2nf | The percentage of rotation speed of the power turbine stage |
| mainRotorRpmPercentage | The main rotor RPM Percentage. |
| mainRotorRpm | The main rotor speed in revolutions per minute (RPM). |
| tailRotorRpm | The tail rotor speed in revolutions per minute (RPM). |
| mainRotorTorque | The main rotor torque. |
| e1Itt | Interstage Turbine Temperature which is the same as T5 |
| e2Itt | Interstage Turbine Temperature which is the same as T5 |
| mainRotorInducedInflow | Induced inflow velocity at the main rotor |
| mainRotorInducedInflowMax | Maximum induced inflow velocity downstream of the main rotor (approximation from momentum theory). |
| flightDirectorPitch | Pitch on flight director. |
| flightDirectorRoll | Roll on flight director. |
| attitudeHoldMode | Altitude Hold mode |
| hasSasEngaged | Stability augmentation system (i.e., trimming) status. Indicates whether it is on of off. |
| autoPilotMode | Mode of autopilot (i.e., Heading, vertical speed, altitude, nav, ils, decel, vorapproach, airspeed, altitude-pre, backcourse, standby, glideslope-annunciator ) |
| hasAutoPilotDisengaged | Autopilot engaged/disengaged switch |
| enum | Not listed |
| nav1HorizontalDeviation | Not listed |
| nav1VerticalDeviation | Not listed |
| nav2HorizontalDeviation | Not listed |
| nav2VerticalDeviation | Not listed |
| gpsHorizontalDeviation | Not listed |
| gpsVerticalDeviation | Not listed |
| commRadio1 | VHF ATC Communication radio 1 frequency |
| commRadio2 | VHF ATC Communication radio 2 frequency |
| navRadio1 | VHF Navigation radio 1 frequency |
| navRadio2 | VHF Navigation radio 2 frequency |
| outsideAirTemperature | The outside air temperature near the rotorcraft |
| surfaceWindSpeed | To be defined. |
| surfaceWindDirection | To be defined. |
| hasBatteryWarning | Indicates that there is a battery warning; e.g., low battery or battery failure warnings. |
| hasGpwsAlert | Indidates that the Ground Proximity Warning System (GPWS) is warning that you are flying too low are are in danger of flying into the ground. |
| hasEngineChipCaution | Caution Indicator for Engine Chip Light. |
| hasFuelLowCaution | Caution Indicator for Low Fuel condition |
| hasGeneratorFailureWarning | Indicates the generator has failed. |
| hasHydraulicSystemWarning | Indicates a problem with the hydraulic system. |
| hasMainRotorLowRpmWarning | Indicates the main rotor RPM goes much below the bottom of the green arc. |
| hasMainRotorHighRpmWarning | Indicates the main rotor RPM goes much above redline |
| hasTailRotorChipWarning | Indicates that there is a tail rotor chip warning. |
| hasTransmissionChipCaution | Caution Indicator for Transmission Igb (Interplanmetary gearbox) Chip Light. |
| hasTransmissionOilTemperatureWarning | Indicates that the engine is runing exceesively hot |
| hasTransmissionOilPressureWarning | Indicates the engine oil pressure is low. |
| timestamp | Time in ISO 8601 format |
| gpsDateTime | GPS date/time in ISO 8601 format |
| seconds | GMT/UTC time in seconds from epoch time |
| vil | The vertically integrated liquid level; -97 No WX Data, -2 Not Processed, -1 Clear Skies, 0 Very light precipitation, 1 Light precipitation, 2 Light to moderate rain, 3 Moderate to heavy rain, 4 Heavy rain, 5 Very heavy rain; hail possible, 6 Very heavy rain and hail; large hail possible |
Data Preparation/Cleansing/Transformation
Data Preparation
The data that the FAA has provided is several RoAR formatted csv's and several flight logs. The flight logs have the labels that need digitized and combined with the RoAR csv's to create a well-versed data set. For this step in the project, several tools are capable for data processing. Using R, python, or even excel could perform the data munging needed to complete this task. The best tool for this data set is going to be python for several reasons. First, python is a strong development platform that can augment the data in any means necessary. The second reason is developing a jupyter notebook with markdown and code becomes an extremely clean and professional way to provide the research back to the FAA. Lastly, python will most likely be the data modeling tool and thus will allow for formats and column types to be optimized for future modeling.
As described before, the data comes from a very well-produced simulation source. The raw data is then converted into RoAR format by the customer and provided back to UMGC. The data has no missing values and is in great quality. The flight logs are well documented but not easily digitized. The data will need to be converted into a data frame and then used to combine with the RoAR data for a labeled dataset. The labels are important because of the nature of the data; there is a lot of room for noise to occur and unsupervised models may have a difficult time cutting through the noise. By utilizing labels, we can circumvent this weakness in unsupervised methods and focus on defining definite characteristics of the flight path.
The last thing that may need to happen is the development of trajectory vectors. If individual rows aren't enough to create a supervised model, it may be important to summarize this information as an aggregate of 3,5 or 10 seconds. This would lead to the creation of new data points like, vertical speed, horizontal speed, horizontal angle, altitude to ground level and others. The data is in a time series format, but because of the difficulty and extreme variety of flights, abstracting the data in a timeless bound data point may prove to show interesting insight. If that doesn't work, the aggregate data points still abstract the data of the helicopter while removing the bounds of time.
Data Cleansing
This section is the hardest because the data is already so clean. Running a quick analysis on the data shows that none of the 109 columns have N/A values. The simulator creates the data in a clean manner and the processing done by FAA to create the RoAR format leaves very little room for error. The flight logs are handwritten and is the only real thing that needs to be converted into a data frame for the model to be used. For the sake of ease, python will be used because the jupyter notebooks format will allow for the code to be well written and for the FAA to receive the analysis back in a well-made and professional manner. Python is also what the final model will be ran in and thus, cleaning the data will ensure that the data types and format are exactly what is needed.
For the flight logs, the data will be handwritten in python as a data frame. Converting the data into a data frame will be tedious but, by doing so, will allow the data to be easily propagated to the larger data frame and munged in such a way that a many to one relationship will be quickly created. Below is a screen shot o the handwritten flight logs to show what will need to be created.
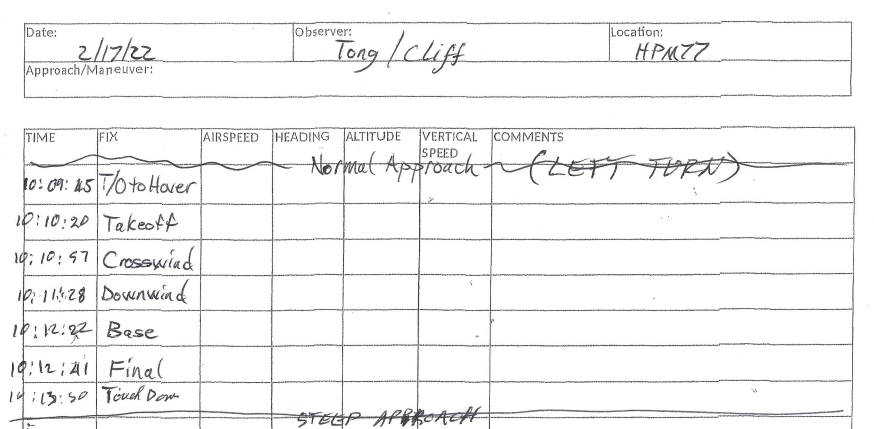
The column will consist of time, flight leg, type of turn, and for the touch down the type of approach. This will allow a quick merge to the other RoAR data for further analysis.
Although tedious the data cleaning process is straightforward and shouldn't require a lot of work. The simulation data is well made and clear which allows for this step in the process to go quickly and allow for more time for analysis.
Data Transformation
The data provided is simulation data of a helicopter and processed into a very clean and well created RoAR format. Due to the nature of the data and the platform of collection, most of the data is numerical in nature and has a range or calculation to look back on. Some standardization or normalization might be needed to make this data run appropriately for the models. Several columns are labeled as has_ where after the underscore is a system like auto pilot or other flight controls. These data points are labeled as true and false and will be converted into 0 and 1 so all columns are numerical in manner.
The FAA has identified the following fields as important:
For the Approach
- Altitude — Parameter starts at typically 500' or 1000' AGL and decreases to altitude of helipad or runway AGL or a hover a few feet above this altitude.
- Airspeed — Parameter starts at around 60 kts. and decreases to zero at touchdown or hover.
- Vertical Speed — Might already be zero or some negative value in fpm but decreases in value (typically negative 100–500 fpm) and becomes zero in hover or touchdown.
- Weight on Wheels — Has a value of 1 when each wheel (main or nose gear) touches down on helipad or runway.
- Descent Angle — Identifies normal, steep, or shallow approach.
Traffic Pattern
- Altitude — Typically starts at ground level, although depends on when you enter the pattern if on a 45 degree to downwind it could be at pattern altitude, which is typically around 500' or 1000' AGL and decreases to the altitude of the helipad or runway AGL or a hover a few feet above this altitude on final during the approach leg of the traffic pattern.
- Airspeed — Parameter starts at 0 kts. if on the ground and increases to around 90 kts. during crosswind or downwind and decreases to 60 kts. during final and then becomes 0 kts. at touchdown or hover.
- Vertical Speed — Starts at zero if on the ground or entering the traffic pattern from a 45 degree but increases in value during the departure/upwind and crosswind legs, remains steady during the downwind leg, and then decreases in value during the end of the downwind leg and onto the base and final legs (typically 100–500 fpm) and becomes zero in hover or touchdown.
- Weight on Wheels — Has a value of 0 when airborne and 1 when each wheel (main or nose gear) touches down on the helipad or the runway.
Part of this assessment will see if these values are truly important and maybe look at other variables that may be important. The only values being removed are ID, time, date, gpsDatetime, and autopilot type. There are several time stamps, the most valuable one will be used.
For other data preparation, the data may be manipulated into a sum of 3,5 or 10 seconds. This will create several new variables like mean speed, mean pitch, mean angle, and other variables. Evaluating if the data is better binned into seconds or individual will showcase if the data is time reliant or not. If the data is not time reliant, a more precise real-time prediction can take place. If a time series needs to be introduced, a near-real time method will need implemented.
Data Analysis
Data Analysis (visualizations and machine learning models) are a huge part of any data science project. There are a range of tools that have been developed and utilized to enhance the production of data analysis. Some tools include, SAS, R, python, H20.ai, and many more. Automating the data analysis is a large specialty of these types of technology. For predicting the flight pattern of helicopters in rotorcraft data, python is going to be the best choice. Python is a robust open source and free software that can handle a lot of data. Keeping the data cleaning, transformation and visualization in python allows for easy control of the environment and to make sure the data is processing the same.
Another consideration is the need for the output of the project to be implemented in FAA systems. Currently python is one of the largest programming languages in the DoD and that is no exception to the FAA. The RAISE platform and code provided by other partnerships are done in python. The script provided by UMGC on detecting phase of flight (climb, decent, hover) was also written in python. Another useful thing is the ability to create markdown files in jupyter notebook which will allow the ability to easily reproduce the work once handed back to the FAA. The markdown format is an easy to read and follow format and allows for clear instructions. Python also supports the ability to create virtual environments. This will be essential so that when the model is provided back to the FAA, they can replicate the packages installed and versions to ensure system compatibility and model integrity.
For visualizations, some plotting of flight paths in either a 2d or 3d space will help provide a clear picture of the flight pattern. I would often use a h3 package (https://eng.uber.com/h3/) to correlate the data to a hexagonal bin and do some analysis on frequency. For this data set, that shouldn't be needed, instead the data will need to be correlated to predict some type of phase. A pair plot will be used to see any large correlation between variables and remove any co-correlated variables that my appear. Other visualizations will include looking at specific data and grouping them by phase to see if there are any stark correlations that can rise to the surface with a quick plot. Testing some of the previously mentioned key variables will be key in identifying if they show an immediate correlation.
For the predictive model, a decision tree should be able to provide the best results. The FAA is looking for a model that is deterministic and can run on a variety of sensors but not too computationally heavy. Models like neural networks may be able to provide insight but the need for highly explainable models is imperative to the success of the model. Some systems may not be able to run regression models while handling the other data incoming, but a quick decision tree would also for an easily explainable and more concrete model to implement within current systems. Decision trees, ensemble trees, random forest, and gradient boosted trees will all be tested for accuracy and statistical significance.
Data Visualization
Data Visualization 1
A pair plot is used to discover any immediate trends in the data. For the pair plot, ground speed, absolute altitude, gps altitude, true air speed, vertical flight path angle and e1fuelflowrate are used with the phase for coloring. This allows any natural classifications to rise to the surface and show trends that may be identified. These specific columns were used because they were identified as important by SME or were ones that had general interest. A pair plot will take each column and plot them against each other and color on the phase to show the potential correlation. See figure one for the resulting plot.
In the visualization several trends start to appear. This is good because it can show information, we expect to show up in decision trees. First let's look at the absolute altitude feature; this variable shows a little bit of clustering when compared against vertical flight path angle. It seems that a high vertical flight path angle in conjunction with a climbing absolute altitude is most likely part of the takeoff phase. This makes sense when you think of a helicopter starting to take off and its angle increases as they increase speed.
Overall, the two most substantial features are vertical flight path angle and E1 Fuel Flow Rate. The vertical flight path angle shows that typically take offs have a high flight path angle, the final has a low or negative flight path angle. When vertical flight path angle is compared against other features, we start to see some distinctions with takeoff above and final below. There is also downwind on the far right for groundspeed, altitude, and airspeed.
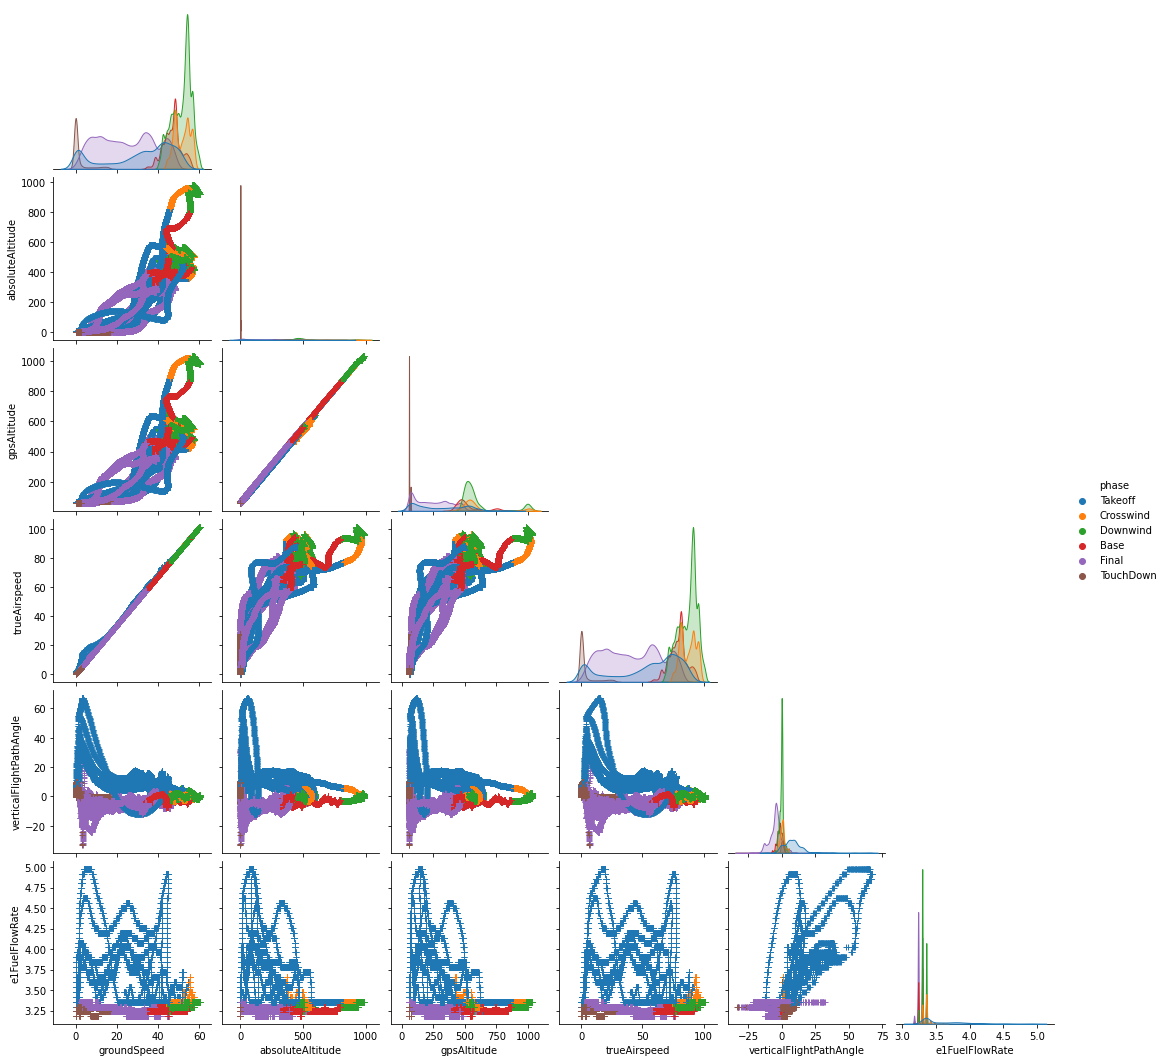
Some information is not as useful, when looking at absolute altitude and gps altitude, we can notice that all comparisons are with these features look identical. This means that these two fields are most likely very similar or the same as far as values. To look further into this, a correlation plot will need to be used to identify values that may or may not be highly correlated and make sure that our data is as unique as possible. If there are highly correlated variables, the model may struggle in deciding which variable to choose or it may use one to predict another. In the classification model this could look like two nodes that are the same, but the model says is different.
This visualization helps to support the original hypothesis that using decision trees are a feasible model to predict class for the phase of flight. Some data will need to be manipulated in triaged to ensure the model is provided the proper information but does not change the scope of the project. We can expect that vertical flight path angle and e1 fuel flow rate to be present in the classification model.
Data Visualization 2
The first visualization showed that some features may have a high correlation, which will need to be resolved to feed the features to a classification model. In the below correlation plot we plot the 80 columns against each other to see high correlation. Using some code to offset the correlation so that zero shows no correlation, one shows high correlation and negative one shows inverse correlation.
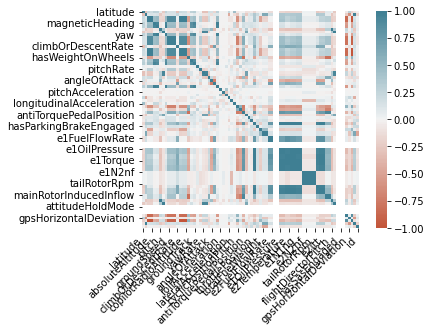
The visualization shows that there are a few features with high correlation. There is the expected diagonal line across the graph that we see correlation, but we can also see groups of squares that have high correlation.
In the first visualization there was an obvious similarity with the absolute altitude and gps altitude. It would be expected that in the grouping of high similar squares, gps altitude, copilot radio altitude and other altitude features will be highly correlated. The next step is to identify the upper bound of about 95% correlation and remove them from the data frame. The following features were identified as too highly correlated and removed:
['absoluteAltitude', 'yaw', 'indicatedAirspeed', 'trueAirspeed', 'barometricAltitudePilot', 'pilotRadioAltitude', 'copilotRadioAltitude', 'horizontalFlightPathAngle', 'grossWeight', 'e2FuelFlowRate', 'e1OilPressure', 'e2OilPressure', 'e1Temperature', 'e2Temperature', 'e1Torque', 'e2Torque', 'e1N1ng', 'e2N1ng', 'e2N2nf', 'mainRotorRpmPercentage', 'mainRotorRpm', 'tailRotorRpm', 'mainRotorTorque', 'e1Itt', 'e2Itt', 'mainRotorInducedInflowMax', 'flightDirectorPitch', 'flightDirectorRoll', 'surfaceWindDirection']In the list of removed features we see indicated airspeed and true airspeed were removed while ground speed was retained for overall speed calculations. There is also absolute altitude, barometric altitude pilot, pilot radio altitude and copilot radio altitude which were removed, while gps altitude was kept. Removing these highly corelated variables allows for the data to perform in the subsequent classification models. The resulting data has 51 columns.
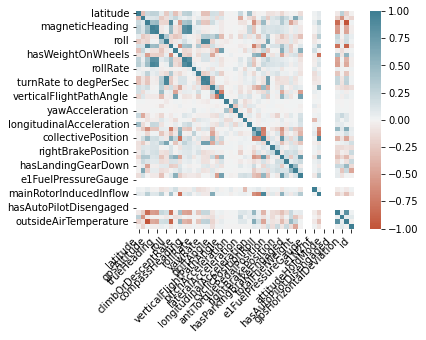
In the figure we see that the correlation of variables is significantly reduced. Variables that were not correlated start to show, like magnetic heading and gps heading. For now, this data will be good to start classifying with, but either heading may remove if those variables start to cause noise in the data. Overall, the correlation matrix shows a cleaner and more robust dataset to ingest into the classification model.
The correlation matrix is a good visualization to show how the data is inter-correlated and provide further information on features going into the model. It does not change the scope of the models; instead, it should help increase the robustness of the classification model and allow for only the most important features to come to the top of the model. The success of the model is largely dependent on being able to clearly explain which features had impact and being able to help the FAA focus efforts on those significant features.
Data Visualization 3
For Visualiztion 3, histograms where plotted on each variable. This helps provide a clear picture of each variable and helps to show what the data consists of. The plot consists of 51 histogram plots, one for each feature, with the y-axis being the count of observations and the x-axis being the value for that feature. Key things to look for are anomolous numbers, plots with no variation and understanding the data going in and target variables.
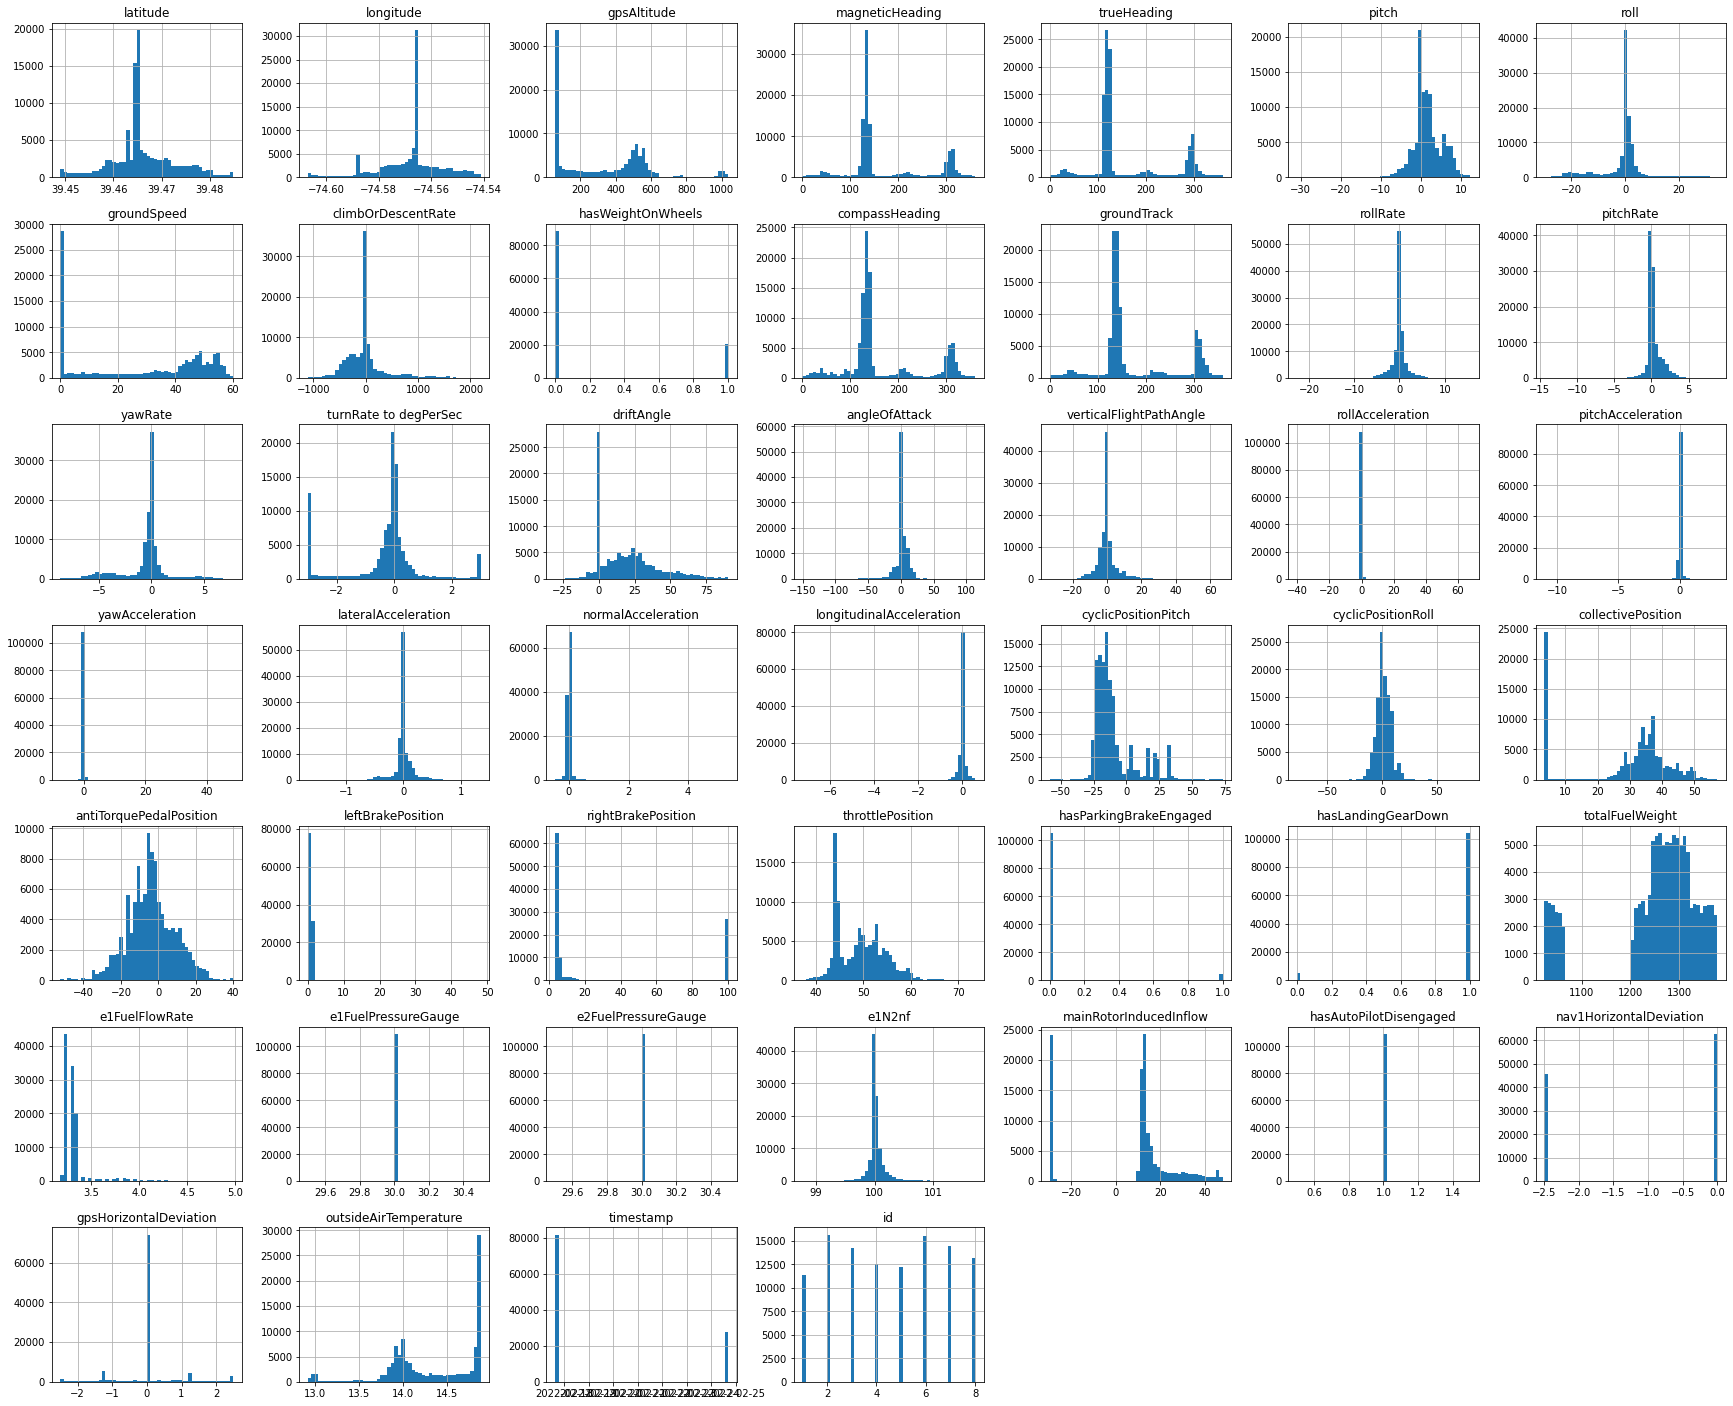
In the histogram plots, there is a noticeable gaussian curve on most of the features. For example, latitude, longitude, pitch, and roll all have a normal distribution of data. The weight on wheels histogram has a key observation; the data is mostly on zero, which means the helicopter is in the air while only on landing and take-off do the weight on wheels go to one (true). Another observation is the acceleration of roll, pitch, and yaw, which for the most part all center on zero. There are observations elsewhere but so much of the data is neutral that the histogram does not show up. I expect that these features won't appear in the classification model, unless those smaller changes have a large impact on classification.
Another key observation is the distribution over the 'id' column. The id column is a self-made column that shows the count of observations that are added into the data for each flight. There are eight flights that are in this data set over three csv's and aggregated together. Each flight has roughly 10,000 to 15,000 records added into the overall data set. The benefit of having each flight be the same is that no flight will overtake the model and each flight should help create a picture of the overall flight patterns.
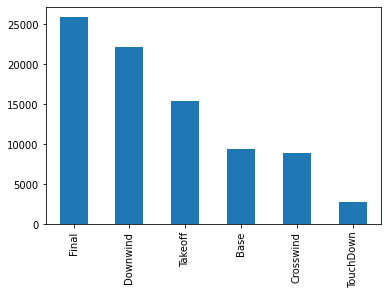
One variable that is not put into a histogram is the distribution of the target variable, phase of flight. In the following histogram, the phase of flight is plotted to ensure that there is not a large skew in classification. In the plot, there is a large amount of touchdown data, likely due to the manual labeling of the data which the time stamp can be labeled a few seconds after actual touchdown. Overall, there is not an overly large anomaly of target variables, and all variables are well represented. When the model is being analyzed for accuracy, some evaluation will need to ens are accurately representative, i.e., not all missed observations are in these lower count features.
This data does not change the scope of the project, but it could be helpful to further scrutinize base and crosswind classification to ensure that these are not mis-represented in the data. The easiest way to address this variable is by adding a cost penalty to the model to ensure that the model is not choosing to ignore the smaller parts of the target variable.
Proposed Visualizations
Classification models have tons of visualization that can be utilized to predict what variables may or may not be used in the model and what variables can be expected to be more interesting than others. One visualization that could have been added is some time series data showing all flights with the phase of flight. The difficulty in this would be predicting which feature would be the most important. In typical time series analysis for airplanes, the altitude would be the most impactful for telling the story of the helicopter flight. If the data was presented in such a manner that showed the phase and the altitude further information could be gathered.
The model could also help drive what further visualizations could be beneficial for the time series analysis. Since the focus is near-real time phase of flight identification, most of the time series data was abstracted out so that it could be rendered on the users end without the need of a post-processing of the data. There is still benefit in the development of time series visualizations The information gleaned from those types of visualizations could be used to guide or create more hypotheses on the data.
The second visualization that could be useful is geospatial mapping of each flight. An avenue that was not explored was geospatial calculations and the ability to calculate phase via correlation to landing strip. This methodology will be discussed later but a visualization could help to show the flight path over the area with the landing pad. This would type of visualization would help to highlight the pilot's phase of flight path and be an estimate of what one could look like. There are packages like python geopandas, H3, and others that can be used to help map out the phase of flight path and several algorithms could be developed and deployed to evaluate what is needed to come to the classification.
This type of analysis could identify the ability to not rely on helicopter systems on measurement and predict the phase of flight via helicopter sensors. Instead, it would help identify the phase of flight purely based on geospatial relation to the landing strip. If possible, it could help radio control towers predict where in flight pattern the rotorcraft is without the need for relay from the aircraft sensors. For our purposes, this avenue will be explored with the data, but not answered as it does not fit in the scope of the work.
Predictive Models
The following section walks through three separate tests that were performed on the data and the resulting accuracy, precision, recall, and F1 score. The three types of trees where tested, Decision Tree, Random Forest, and Gradient Boosting Trees. The first test analyses the features and understands which are important. The second test modifies the tree depth, and the last test changes the minimum leaf samples. The weighted values are weights added to the target variable to account for the target variable imbalance. The following table is a comparison of all 17 models ran (model number is an id not a ranking):
| Model Number | Accuracy | Weighted Precision | Weighted Recall | Weighted F1 | Model Type | Tree Depth | min leaf samples |
|---|---|---|---|---|---|---|---|
| 1 | 89.97% | 90.66% | 89.97% | 0.901 | Decision Tree | 6 | 1500 |
| 2 | 87.39% | 87.15% | 87.39% | 0.870 | Decision Tree | 6 | 1500 |
| 3 | 84.35% | 85.75% | 84.35% | 0.846 | Decision Tree | 6 | 1500 |
| 4 | 92.67% | 92.86% | 92.67% | 0.927 | Random Forest | 6 | 1500 |
| 5 | 99.94% | 99.94% | 99.94% | 0.999 | Gradient Boosting | 6 | 1500 |
| 6 | 83.62% | 85.68% | 83.62% | 0.840 | Decision Tree | 4 | 1500 |
| 7 | 86.37% | 87.52% | 86.37% | 0.860 | Random Forest | 4 | 1500 |
| 8 | 99.88% | 99.88% | 99.88% | 0.999 | Gradient Boosting | 4 | 1500 |
| 9 | 84.35% | 85.75% | 84.35% | 0.846 | Decision Tree | 8 | 1500 |
| 10 | 94.22% | 94.46% | 94.22% | 0.943 | Random Forest | 8 | 1500 |
| 11 | 99.95% | 99.95% | 99.95% | 1.000 | Gradient Boosting | 8 | 1500 |
| 12 | 87.52% | 88.39% | 87.52% | 0.877 | Decision Tree | 8 | 1000 |
| 13 | 96.21% | 96.28% | 96.21% | 0.962 | Random Forest | 8 | 1000 |
| 14 | 99.94% | 99.94% | 99.94% | 0.999 | Gradient Boosting | 8 | 1000 |
| 15 | 92.38% | 92.53% | 92.38% | 0.924 | Decision Tree | 8 | 500 |
| 16 | 97.81% | 97.84% | 97.81% | 0.978 | Random Forest | 8 | 500 |
| 17 | 99.93% | 99.93% | 99.93% | 0.999 | Gradient Boosting | 8 | 500 |
Group 1 (Features) Predictive Models
The first group tests different groups of features to see how they would initially impact the model. The baseline model is running off a decision tree model because it has the easiest to understand explainability power behind the model. This is helpful as it allows the model to be easily digested and errors are more obvious. There were three baseline models ran to test feature importance to the classification of the flight pattern phase. The following table shows the results of each model:
| Model Number | Accuracy | Weighted Precision | Weighted Recall | Weighted F1 | Model Type | Tree Depth | min leaf samples |
|---|---|---|---|---|---|---|---|
| 1 | 89.97% | 90.66% | 89.97% | 0.901 | Decision Tree | 6 | 1500 |
| 2 | 87.39% | 87.15% | 87.39% | 0.870 | Decision Tree | 6 | 1500 |
| 3 | 84.35% | 85.75% | 84.35% | 0.846 | Decision Tree | 6 | 1500 |
Model one ingests all 46 features from the initial data frame, with only highly correlated columns and timestamps removed. The model with all the features had the highest accuracy as well as the highest F1 score. The models can all be found in the jupyter notebook provided as work, the following image is the output of the decision tree. The tree depth of 6 and minimum leaf samples of 1500 were arbitrarily start values to have the tree be smaller and not over fit. The first thing that is noticeable in the output of model one is the inclusion of latitude and longitude in the decision tree. The eight flights are from two airports with some doing right and left turns, but for the most part are very similar as far as location. It can be concluded that the model is plotting the actual location and memorizing the flight path instead of using sensor data.
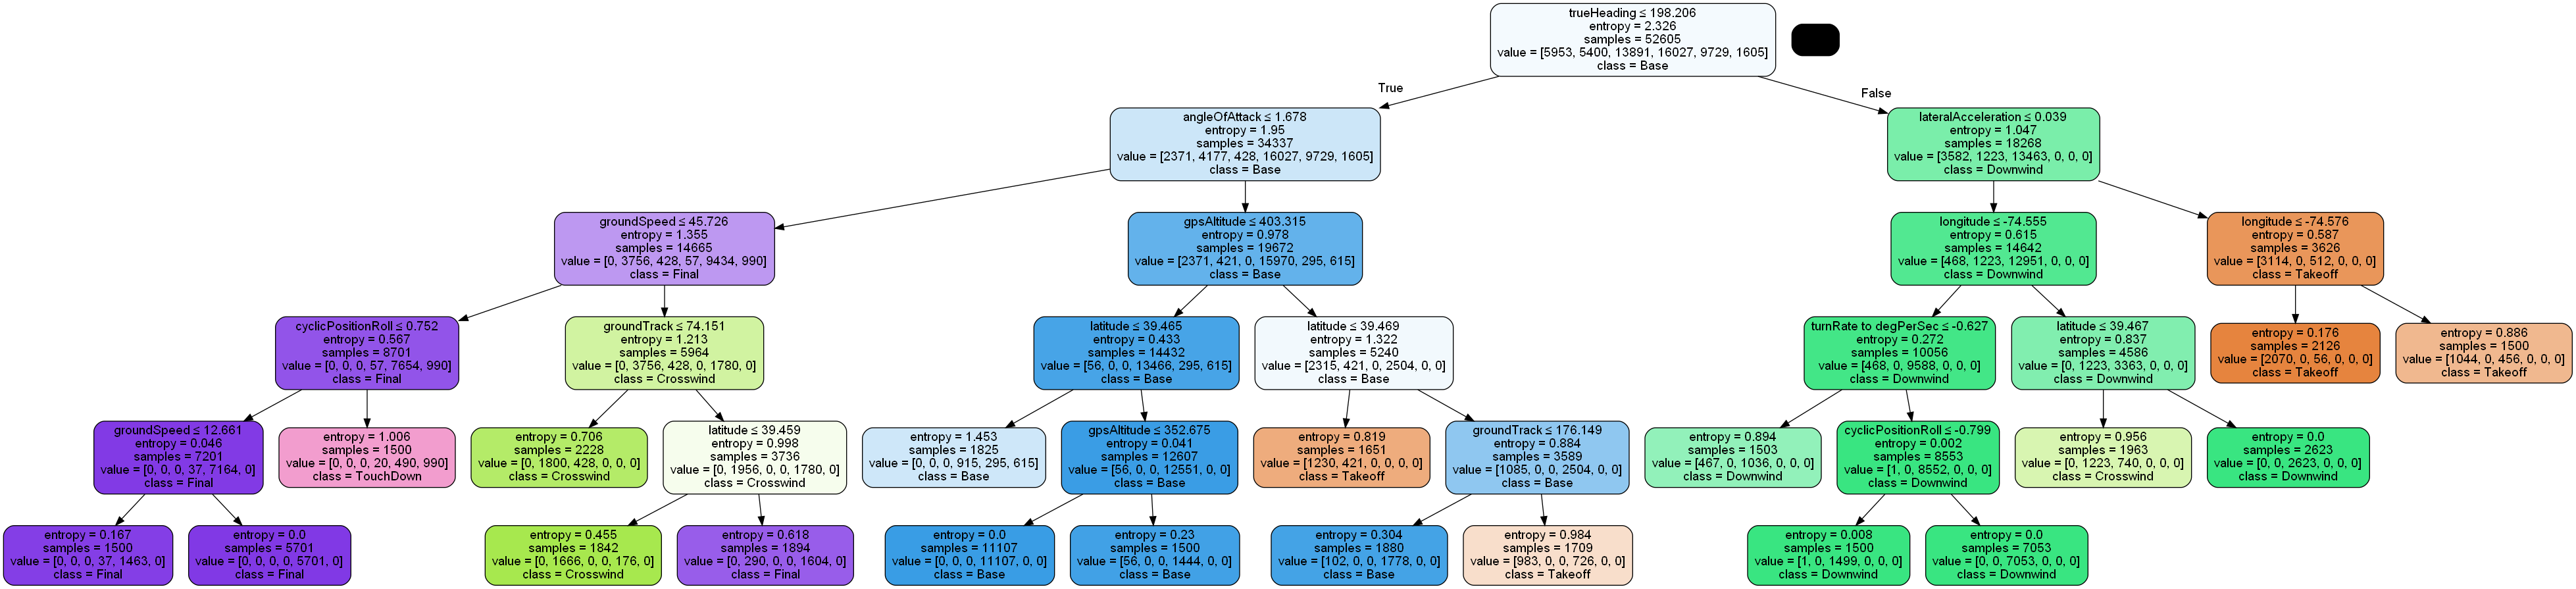
To see the effect, model two removes latitude, longitude, magnetic heading, true compass heading and compass heading. The result is a roughly 2% decline in accuracy, as well as a drop in F1 score. The decision tree used ground track, lateral acceleration, angle of attack, gps horizontal deviation and some other values to classify the resulting flight pattern. This is still a good summation of the data and an accuracy of 87.39% is still very good. Removing the locational data allows for the model to be generalized and applied to other locations, a necessary step in creating a robust model.
Some of these insights were interesting when briefed to the FAA as an initial model. It helps to create an insight of what could or could not be important that may not be directly obvious. After discussing the model with the FAA, the following fields were asked to be removed:
- groundTrack
- e1Temperature
- e1FuelPressureGauge
- hasSasEngaged
- mainRotorInducedInflow
- attitudeHoldMode
- hasAutoPilotDisengaged
- nav1HorizontalDeviation
- gpsHorizontalDeviation
- outsideAirTemperature
- hasParkingBrakeEngaged
- throttlePosition
Removing these columns for model three effected the model by declining the accuracy by another 3% and the F1 score by another 0.03 points. The following were removed because they should not have an impact on the model either because it is non-explanatory or because they are unpredictable. Since the data was ran in a simulation, there was no wind added and thus, the FAA concluded that the horizontal and vertical deviation would be not useful and may through off the model in future use.
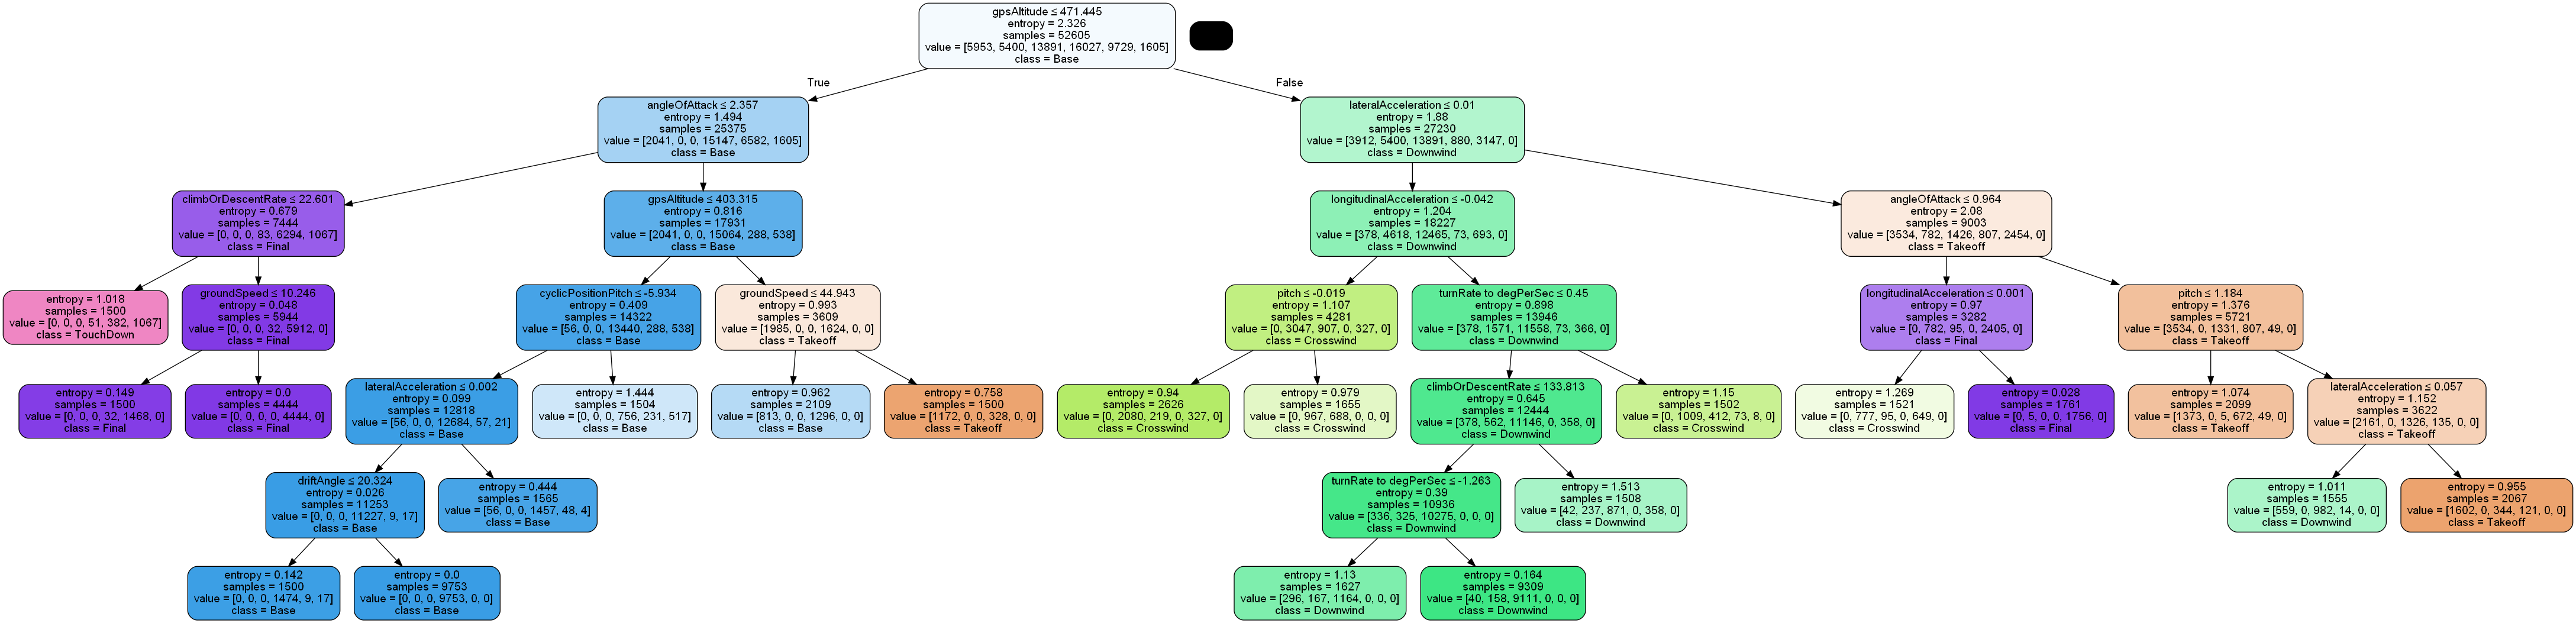
The resulting model three uses gps altitude, angle of attack, longitudinal acceleration, pitch, and ground speed to help identify the class that the data point belongs to. A unique aspect of this is the clear groupings seen by the colors and how it was nearly able to group the data points in very defined segments. This shows that there is a significant feasibility in the model that can detect near-real time standard flight pattern phase.
Predictive Model 2
The second set or models manipulates the argument for the tree depth to determine the optimal number of nodes that work to create a good model without overfitting the model. The model numbers for this set are model numbers 3 through 11. Three model types were ran, decision tree, random forest and gradient boosting, each ran for a node depth of 4,6 and 8. Below is a table of all the models and sorted by accuracy, from highest accuracy to lowest accuracy.
| Model Number | Accuracy | Weighted Precision | Weighted Recall | Weighted F1 | Model Type | Tree Depth | min leaf samples |
|---|---|---|---|---|---|---|---|
| 11 | 99.95% | 99.95% | 99.95% | 1.000 | Gradient Boosting | 8 | 1500 |
| 5 | 99.94% | 99.94% | 99.94% | 0.999 | Gradient Boosting | 6 | 1500 |
| 8 | 99.88% | 99.88% | 99.88% | 0.999 | Gradient Boosting | 4 | 1500 |
| 10 | 94.22% | 94.46% | 94.22% | 0.943 | Random Forest | 8 | 1500 |
| 4 | 92.67% | 92.86% | 92.67% | 0.927 | Random Forest | 6 | 1500 |
| 7 | 86.37% | 87.52% | 86.37% | 0.860 | Random Forest | 4 | 1500 |
| 3 | 84.35% | 85.75% | 84.35% | 0.846 | Decision Tree | 6 | 1500 |
| 9 | 84.35% | 85.75% | 84.35% | 0.846 | Decision Tree | 8 | 1500 |
| 6 | 83.62% | 85.68% | 83.62% | 0.840 | Decision Tree | 4 | 1500 |
The first conclusion from these runs of models is that the gradient boosting seemed to perform the best out of all the models, no matter the node. Following gradient boosting, random forest was the best performing, regardless of node depth and then decision tree. This shows that decision tree is the worst at predicting the standard flight pattern while gradient boosting seems to perform the best. There is caution with gradient boosting, because it is performing so well, it may be prone to over fitting. Further analysis with more data would be critical to determining if gradient boosting models are not as accurate as needed. The gradient boosted model performed with 100 individual trees aggregated.
One thing to note, when it comes to the explainability of these models, the decision tree is the easiest to explain because it is one tree to examine. Random Forest Trees are often a little harder because they are often several trees aggregated into a mathematical formula. Lastly, gradient boosting models are the least able to explain because they are usually hundreds of trees, and the model takes bits and pieces from each one. With this said, each model has important and least important features that help examine the explainability of each model.
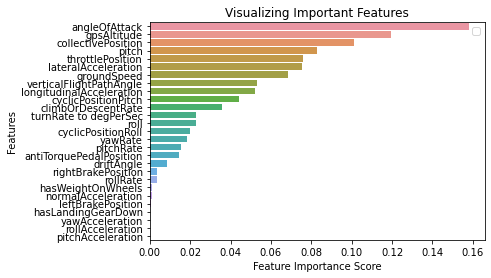
To start and analyze trends, the best performing gradient boosting model (model 11) can be explained by the following visualization. This shows that angle of attack, gps altitude, lateral acceleration, collective position, and longitudinal acceleration are the most important features for this model to perform well.
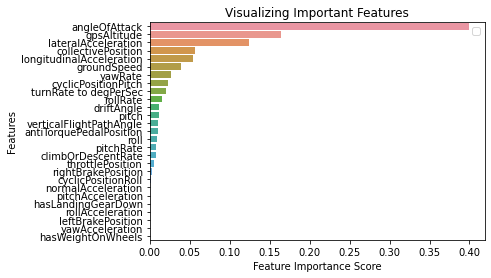
On the other hand, has weight on wheels, yaw acceleration, left break position, and has landing gear down have very minimal effect on the model. This is interesting because you could expect that has landing gear down could help indicate to model that the flight would be in the final approach leg and about to land. Instead, it seems that angle of attack is much preferable.
Model 10 is the best performing Random Forest Model with a tree node depth of 8 and a 94.22% accuracy, a ~5% decrease from the gradient boosting model. In this model angle of attack, gps altitude, collective position and pitch are the most important key features. This is nearly the same as the gradient boosting algorithm and emphasizes the importance of these features and the need for them to be recorded. Similarly, yaw, roll, and pitch acceleration are all very low in importance; like the gradient boosting model.
As seen in previous figures, the random forest model also found importance in the gps altitude, angle of attack and lateral acceleration. All of this further emphasizes the importance of these features. The last key conclusion is whether the tree node depth is significant in determining the ability to classify the standard flight pattern phase. In all three cases the best node depth is eight, albeit the decision tree performs the same for eight and six nodes. These models provide a good starting point for further client feedback on the model performance to determine which hyperparameter is the best for pursuing.
All models performed above 83% accuracy: overall, a good accuracy for machine learning models. The Random Forest models, perform the best without looking like they are overfit. The gradient boosting is performing so high that it may be over fitting, while decision trees are not performing as well. For the next set of models, a tree depth of eight will be used, because it seemed to be helpful for increasing accuracy but not overfitting.
Predictive Model 3
The third set of models changed the hyperparameter of minimum leaf samples to see if it has a large impact on the model. The decision tree, random forest, and gradient boosting model types were tested with a node depth of eight for a minimum leaf sample of 500, 1000 and 1500. In the following table, models 9 through 17 are sorted by accuracy to show how the minimum leaf samples impact the accuracy.
| Model Number | Accuracy | Weighted Precision | Weighted Recall | Weighted F1 | Model Type | Tree Depth | min leaf samples |
|---|---|---|---|---|---|---|---|
| 11 | 99.95% | 99.95% | 99.95% | 1.000 | Gradient Boosting | 8 | 1500 |
| 14 | 99.94% | 99.94% | 99.94% | 0.999 | Gradient Boosting | 8 | 1000 |
| 17 | 99.93% | 99.93% | 99.93% | 0.999 | Gradient Boosting | 8 | 500 |
| 16 | 97.81% | 97.84% | 97.81% | 0.978 | Random Forest | 8 | 500 |
| 13 | 96.21% | 96.28% | 96.21% | 0.962 | Random Forest | 8 | 1000 |
| 10 | 94.22% | 94.46% | 94.22% | 0.943 | Random Forest | 8 | 1500 |
| 15 | 92.38% | 92.53% | 92.38% | 0.924 | Decision Tree | 8 | 500 |
| 12 | 87.52% | 88.39% | 87.52% | 0.877 | Decision Tree | 8 | 1000 |
| 9 | 84.35% | 85.75% | 84.35% | 0.846 | Decision Tree | 8 | 1500 |
The gradient boosting model still outperformed, regardless of minimum leaf sample. The trend follows with random forest and decision tree. This shows that the gradient boosting model will most likely be the highest performing model, followed by random forest then decision tree. The random forest models are the best model that do not seem too overfit with a decent accuracy of 94 to 98 percent. Looking at the minimum leaf sample, there is an obvious increase in each model the smaller the minimum leaf size is. This is most likely because it can change the model to find more ending nodes to land on.
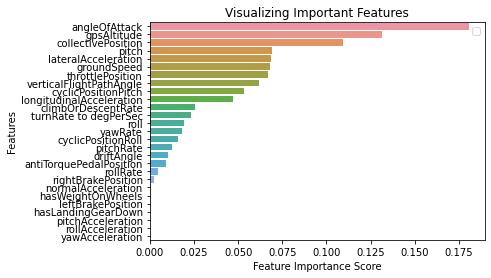
In the above figure, the most important features are printed out for model 13. Like previous models, there is a significant importance for the features angle of attack, gps altitude, collective position, pitch, and throttle position. The same trend for the least important variables remains the same with pitch acceleration, roll acceleration, yaw acceleration and has landing gear down are the lowest ranked. This further emphasizes the key importance of these variables across all models and the importance of collecting these metrics.
It is a very close call between model 13 and 16, with the tree depth of eight for both and a minimum leaf sample of 1000 and 500, respectively. Model 13 has a 96.21% accuracy and model 16 has a 97.81% accuracy. Each flight has roughly 10,000 records, and when combined form roughly 80,000 records. This means there are a total of at most 80 end notes for a minimum leaf size of 1000 and a total of 160 ending nodes for a minimum leaf size of 500. The final determination would best be provided by the FAA but for the sake of generalization, model 13 is chosen to be the best model. This sacrifices a percent of accuracy to greatly increase the minimum leaf size and improve generalization of the overall model.
To further improve the model, more data would mean that you could further increase the size of the minimum leaf node size to enable the generalization of the models. The complexity of helicopter data is the need for generalization and applicability to many situations. Overall, a 96.21% accuracy and a f1 score of .962 shows that model 13 is a robust, reliable, and feasible model for classifying a standard flight pattern phase.
Predictive Model Review
Flight pattern phase was classified by using gradient boosting, random forest, and decision trees. The accuracy of these models was evaluated by back-propagation on features, hyperparameter tuning on node depth and minimum leaf samples. Overall, each model performed well with the lowest performing model, model 6, performing with an accuracy of 83.62%, a node depth of four and a minimum leaf sample of 1500. Model 4 was also a decision tree model, known for its worse accuracy but better explainability. The best model was model 11, with an accuracy of 99.55%, a tree depth of eight and minimum leaf sample of 1500. Model 11 was a gradient boosting model with little explainability and an inclination to overfitting.
The best model to use for classification of a standard flight pattern phase is model 13. Model 13 is a random forest model with a tree depth of 8 and a minimum leaf sample of 1000. This model has an accuracy of 96.21% and is a good middle ground for generalization of the model without overfitting. The below figure is a multi-class confusion matrix that shows the predicted vs the labeled class.
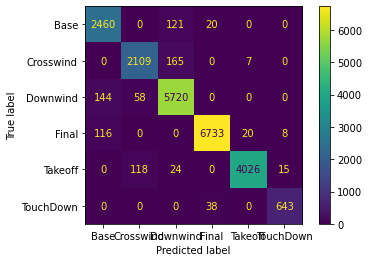
The confusion matrix shows that the final, takeoff and touchdown are the best predicted classes with the most accurate predicted labels. The base, crosswind and downwind classes are harder to predict. For the crosswind, there is the most wrong predictions of takeoff, which means that the model is most likely failing to identify the switch from takeoff to crosswind. Most of the errors seem to be in the transition between phases, which is normal to see since there is no clear difference between phases or time in which you are between phases.
Overall, the model performs well, and key features are identified, and other features are identified as non-relevant. One keynote is the importance of geolocation in the analysis. This model works well but does not have data from outside of the pattern, the best use to integrate it into a currently existing platform is to have a threshold trigger when the model kicks on. This would help mitigate the model predicting when out of the standard flight pattern. All 17 models are documented in a jupyter notebook with their associated key features and confusion matrix. The data and notebook will be provided to the FAA via GitLab repository.
Final Results
Analysis Justification
These sets of models prove our original hypothesis The data analytics problem that I am analyzing is the ability to detect and characterize the six identified classes in a standard flight pattern in a time series data set with an 85% or higher accuracy to increase the overall safety of rotorcraft and decrease risk to pilots is proven successfully. Model 13 has a 96.21% accuracy and a weighted F1 score of .962, showing random forest classification models are a viable solution for near-real time standard flight pattern phase prediction.
This model has the ability to be an edge computed model ran at the rotorcraft level. The model, when running, can then transmit the data to either the ATC or to be broadcast for another rotorcraft to help alert the surrounding pilots on the current state of aircraft in, or not in, the flight pattern. The figure below mocks up the potential applications of the model when running on edge devices.
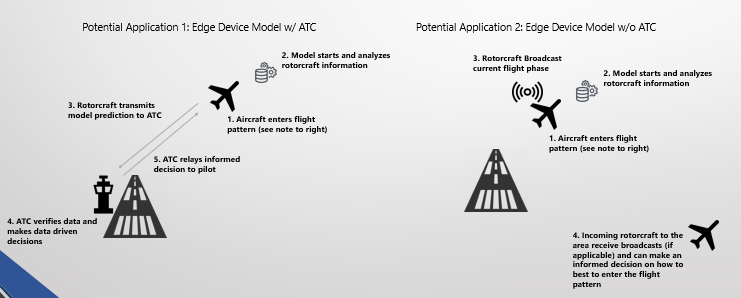
This analysis focused on the feasibility, reliability, and accessibility of a near-real time analytical model to predict the phase of rotorcraft in a standard flight pattern. This type of technology is important because it helps ATC's or other rotorcraft and the pilot make informed data driven decisions. With a over 95% accuracy, the model shows a promising ability to classify the flight pattern. To increase reliability, you could time group and if the model predicts the same phase in the last 5 seconds, then that information could be sent. This could help alleviate momentary misclassifications.
The toughest part of the model is knowing when the model would run. In the below diagram, a rough sketch of when the model would run.
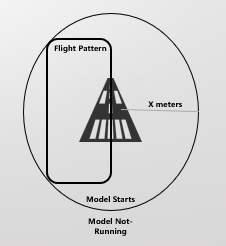
A very simple use case would be to only initiate the model when the rotorcraft is x meters away from the landing strip. This also helps reduce the need for identifying if a rotorcraft is in flight pattern or not, which may or may not be extremely difficult to detect.
Overall, the models run extremely well, are lightweight and are very explicit in the interpretation of features. This model would be useful to help reduce the risk to rotorcraft pilots while increasing the overall safety. As the FAA starts to understand more on the features of importance, further types of classification models can be running, or ensemble models could be utilized to further increase the accuracy of the resulting model.
Findings
Our models are able to confirm the overall hypothesis of machine learnings ability to classify a rotorcraft in a standard flight pattern. The models ran on the data where able to find the following as key insights:
- Overall classification is high with some overlap from the phase before and after
- Interesting to see that take offs are most commonly mis-predicted as crosswind
- It makes sense that a lot of error we see is in the next or prior phase. This is due to the ambiguity of when the 'phase' truly starts.
- The final phase looks like the best predicted class
Important Features
- Angle of Attack
- GPS Altitude
- Collective Position
- Throttle Position
- Lateral Acceleration
- Ground Speed
Non-Important Features
- hasWeightOnWheels
- normalAcceleration
- leftBrakePosition
- hasLandingGearDown
- yawAcceleration
- rollAcceleration
- pitchAcceleration
These insights help to frame the outcomes of the model by showing the key features of importance, regardless of model. It also shows that the models are most often less accurate in classifying the data when transitioning between phases.
This project also highlights the success of extrapolating the data out of a time series. Most analysis being done is highly focused on the dependency of what happens during a time bound flight. This reduces the ability to do near-real time prediction because you are relying on a set of data that could be several seconds or several minutes. The data is able to tell you what phase it is in, regardless of what happened before or after that moment and is complete trained off of a singular time stamp. This is significant and may offer more information to be modeled in similar approach so that the resulting model is computationally light.
Machine learning models often are difficult to put on a system when they are reliant on certain information. The important features would highlight the key data that rotorcraft need to broadcast and or provide as a safety medium. This analysis could also fuel policy on future rotorcraft and the need for certain data to be included or sensors collecting them.
Overall, the model performs well, and key features are identified, and other features are identified as non-relevant. All 17 models are documented in a jupyter notebook with their associated key features and confusion matrix. The data and notebook will be provided to the FAA via GitLab repository. The model is successful in improving the safety of rotorcraft while mitigating the risk.
Review of Success
The analysis was successful in proving the success of the project scope, KPIs and critical success factors. The scope of the project was to identify a rotorcraft and characterize the phase the rotorcraft was in during a standard flight pattern. The model was able to classify six individual classes with a 96.21% accuracy. This proves the feasibility of near-real time prediction of phase of flight during a standard flight pattern. The model is lightweight and emphasizes a deterministic perspective so that the data is explainable without the need for complex algorithms, making it feasible to integrate on the edge or to integrate in current systems.
Our first KPU was to identify flight pattens of helicopter simulation data with a roughly 80% accuracy. This analysis proves that we were able to do that and exceed expectations by 12%. The second KPI was to be able to predict the multi-class target variable with phases in data with an 80% accuracy. The f1 score of .962 shows that, even when accounting for target variable skew there is a significant probability that the model is accurately predicting the multiclass variable.
The third KPI was to be able to characterize the target variable class with ideal parameters and explain ability through important features. This analysis successfully does this by proving that even during multiple types of models, several key features were being identified as significant and non-significant. The last KPI was to Reduce risk to helicopter flight operators by providing tangible insight into helicopter approaches and providing the FAA with at least one model for characterizing flight patterns and approaches. All four KPI's are met and successfully shown as successful for our analysis.
Next, we evaluate the critical success factors that were identified. The first critical success factor was the rotorcraft flight pattern is detected and can be geospatially mapped and tagged in the data. This was done in the data wrangling phase and was able to show the ability to label the data accurately and robust. The second critical success factor was the model can identify the six target classes with decent accuracy. The best ran model performed with an accuracy of 96.21% and successfully proved that we can identify multi-class targets in our data. The last critical success factor is insight into an advanced maneuver and new concepts or understanding of the data is well presented. This is accomplished by showing important and non-important features. The data is also well documented, and the data presented in multiple platforms to give high explainability.
Recommendations for Future Analysis
Even though the model has a high level of success, the data ingested into the model was slightly limited and there are other avenues of research to explore to enhance the robustness of the overall model. This project's models were run on eight unique flights with left turns, right turns, and multiple types of approaches. The two future avenues for analysis are, 1. Inclusion of three additional classes and 2. Location based models.
For the first method, future analysis could include more target classes. This research does not include the 45-degree entrance into the flight pattern, not the straight and 45-degree departure into the flight pattern. This are seen below as item number 1 and 6. This would create a fuller picture of the flight pattern. The models ran in our analysis only focuses on the flight pattern but does not include leaving and entering the flight pattern. The inclusion of this would be very important to create a robust analysis to identify further edge cases.
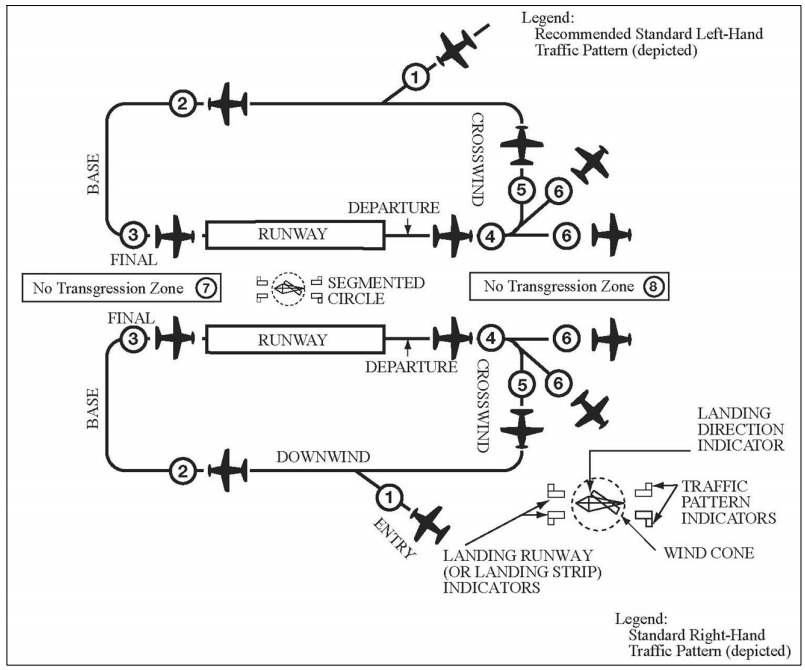
The second method is research opportunity two, location-based models. Our model proved that location could be a viable solution to identify the significance of the phase for the data. This can be seen with the cone like degree in the image below where the phase could be identified in relation to the airstrip. To take this a step further you could utilize Ubers H3 spatial package (https://eng.uber.com/h3/). The benefit is these are consistent sized bins that can even get down to the half a meter size. Plotting the data using this package, seeing the heat map, and predicting the phase of flight based on the H3 bin could prove to be more robust.
The inclusion of the H3 package could help identify patterns on a locational base and the resulting model would be less reliant on sensors from the rotorcraft but reliant on the location and the relation to the air strip. There is a lot of other avenues this research could go, but these two examples are highlighted in our work and could be an extension of this workstream. In conclusion, we were able to predict phase of flight for a rotorcraft in a standard flight pattern with a 96.21% accuracy and prove the feasibility of near-real time prediction on non-timebound data. The resulting model will increase the overall safety of rotorcraft while reducing the risk to pilots.
References
TorkLaw. (2020, December 16). Helicopter Accidents. TorkLaw. Retrieved February 5, 2022, from https://www.torklaw.com/practice-areas/aviation-accidents/helicopters/
Payan, A. P., Gavrilovski, A., Jimenez H., and Mavris D. N. (2017), Improvement of Rotorcraft Safety Metrics Using Performance Models and Data Integration, AIAA Journal of Aerospace Information Systems, Vol. 14, No.1, pp. 26-39. DOI:10.2514/1.I010467
Payan, A., Gavrilovski, A., Jimenez, H., and Mavris, D. (2016), Review of Proactive Safety Metrics for Rotorcraft Operations and Improvements Using Model-Based Parameter Synthesis and Data Fusion, AIAA Infotech@ Aerospace, San Diego, California, 4-8 January 2016, DOI:10.2514/MIAA16
Alexia P. Payan, Po-Nien Lin, Charles Johnson, and Dimitri N. Mavris (2017), Helicopter Approach Stability Analysis Using Flight Data Records, 17th AIAA Aviation Technology, Integration, and Operations Conference, AIAA AVIATION Forum, Denver, CO, 5-9 June 2017, DOI:10.2514/MATIO17
Hsiang-Jui Chin, Alexia Payan, Charles Johnson, and Dimitri N. Mavris (2019), Phases of Flight Identification for Rotorcraft Operations", AIAA SciTech 2019 Forum, San Diego, CA, 7-11 January 2019, DOI:10.2514/MSCITECH19
Hsiang-Jui Chin, Alexia P. Payan, Dimitri Mavris and Charles Johnson (2020), Knowledge Discovery within ADS-B Data from Routine Helicopter Tour Operations, AIAA Aviation 2020 Forum, 15-19 June 2020, DOI: 10.2514/6.2020-2872
Hsiang-Jui Chin, Alexia P. Payan, Charles Johnson, and Dimitri Mavris (2021), Anomaly detection in initial climb segments for helicopter operations, VFS Forum 77, 10-14 May 2021
Joseph N. Robinson, Alexia P. Payan, Dimitri Mavris and Charles Johnson (2021), Visual and Instrument Helicopter Approach Stability Analysis Using Data Fusion and Data Analytics, AIAA SciTech Forum, 1115 & 1921 January 2021, DOI: 10.2514/6.2021-0528
Traffic Patterns. (2021, February 19). Flight Literacy. https://www.flightliteracy.com/traffic-patterns-2/